

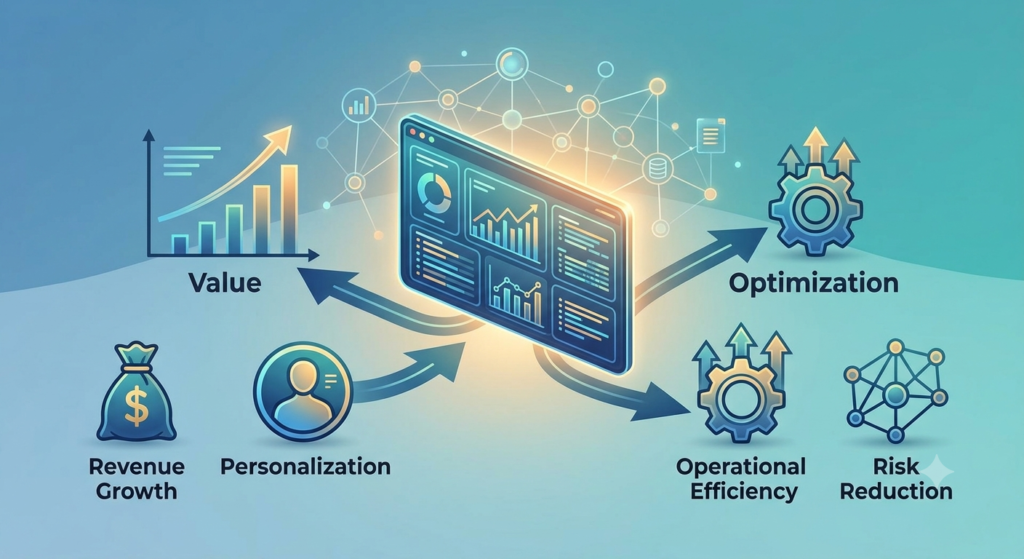
In the modern digital landscape, information is generated at an unprecedented velocity. Every click, transaction, sensor reading, and social media interaction contributes to a burgeoning global repository of data. However, raw data in its nascent form is merely noise. The process of converting this noise into signal—into actionable insights that drive growth, efficiency, and innovation—is known as data analysis.
Data analysis is no longer a luxury reserved for multinational corporations. It has become a fundamental competency for any organization seeking to remain competitive in a landscape defined by rapid fluctuation and intense competition. This comprehensive guide will explore the multifaceted world of data analysis, providing a roadmap from technical fundamentals to advanced strategic application, ensuring you can harness the full potential of your information assets.
1. What is Data Analysis? An Essential Definition
Data analysis is the systematic process of cleaning, transforming, modeling, and examining data to discover useful information, suggest conclusions, and support decision-making. It is a multi-disciplinary field that sits at the intersection of statistics, computer science, and business strategy.
The Purpose of Analyzing Data
The core objective is to extract meaning. This meaning allows organizations to answer critical questions:
- Retroactive Questions: What happened? and Why did it happen?
- Proactive Questions: What might happen? and How can we make it happen?
By moving beyond gut feeling and anecdotal evidence, data analysis empowers leaders to make evidence-based decisions that hold up under scrutiny.
2. The Seven Pillars: The Step-by-Step Data Analysis Process
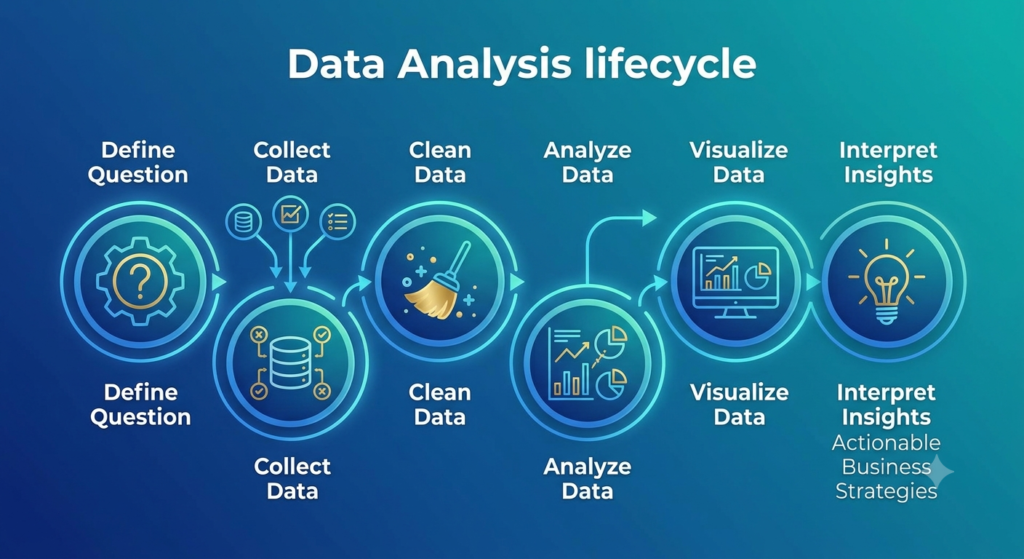
Effective data analysis is not a random act of exploration; it is a structured, repeatable workflow. Following this seven-step framework ensures accuracy, reliability, and relevance.
Step 1: Define the Question or Problem
The most critical step happens before any data is touched. You must clearly define the business problem you are trying to solve or the question you need answered.
- Good Question: “What are the top three factors causing customer churn in our premium subscription tier?”
- Poor Question: “What does the customer data tell us?”
A well-scoped question provides focus for the entire project, determining what data needs to be collected and which analytical techniques are appropriate.
Step 2: Data Collection
Once you have a focused question, the next step is gathering the required raw information. Data can originate from diverse sources:
| Data Type | Examples | Typical Sources |
|---|---|---|
| First-Party | Customer transactions, website logs, survey results. | CRM, Google Analytics, internal databases. |
| Second-Party | Another company’s first-party data (shared). | Partnership agreements, data marketplaces. |
| Third-Party | Aggregated data from large, impersonal sources. | Government censuses, weather reports, industry studies. |
The key during collection is to ensure the data is relevant, accurate, and sufficient to address the defined question.
Step 3: Data Cleaning (Wrangling/Preprocessing)
This is often the most time-consuming phase, but it is indispensable. Raw data is inherently messy. It contains errors, missing values, duplicates, and inconsistencies.
Cleaning involves:
- Removing Noise: Eliminating irrelevant or duplicate records.
- Handling Missing Values: Deciding whether to delete rows, fill them with a mean value, or use imputation techniques.
- Correcting Inconsistencies: Ensuring “USA”, “United States”, and “U.S.” are standardized into a single format.
Unclean data produces unreliable analysis. The principle of “Garbage In, Garbage Out” (GIGO) applies absolutely to data analysis.
Step 4: Data Exploration (EDA – Exploratory Data Analysis)
Before building complex models, analysts perform a preliminary investigation to understand the data’s basic characteristics. EDA uses simple summaries and basic visualizations to spot patterns, anomalies, and relationships between variables.
EDA helps you understand the distribution of your data (e.g., is your customer base mostly young or old?) and identify potential errors that the cleaning phase might have missed.
Step 5: Performing Detailed Data Analysis
This is the core mathematical phase where you apply analytical techniques to uncover the “why” and “what next.” This is generally divided into four levels of sophistication (detailed in Section 3). Techniques can range from simple statistical summaries (like mean and correlation) to complex regression modeling, time-series forecasting, or machine learning algorithms.
Step 6: Data Visualization
The most profound insight is useless if it cannot be communicated clearly to stakeholders. Data visualization is the art of translating numerical findings into graphical representations—charts, graphs, heatmaps, and dashboards.
Effective visualization highlights key trends, differences, and outliers instantly, allowing non-technical leaders to grasp complex relationships at a glance.
Step 7: Interpreting Results and Communicating Insights
The final step is to translate the visualized data back into the language of the business. An analyst must interpret the findings in the context of the original question (defined in Step 1).
The final deliverable is not just a report; it is a narrative with a clear recommendation for action. For example: “Because our EDA shows churn peaks after the 12th month (Step 4), and detailed analysis shows that low usage of Feature X is the primary predictor (Step 5), we recommend launching a Feature X engagement campaign specifically targeting customers in months 10–11 (Step 7).”
3. Four Types of Data Analysis: From Hindsight to Foresight
Analytical techniques vary in complexity and the value they add to the business.
                  Value & Complexity Curve

            |                          * Prescriptive
            |                      * Predictive
 Value      |                  * Diagnostic
            |              * Descriptive
            +--------------------------------------
               Difficulty / Sophistication
Type 1: Descriptive Analysis (What Happened?)
The most basic form of analysis, focusing on summarizing historical data to provide context. It looks at the past.
- Examples: Monthly sales reports, website traffic summaries, year-over-year revenue growth.
- Purpose: To provide a clear picture of performance and current status.
Type 2: Diagnostic Analysis (Why Did it Happen?)
The next logical step, focusing on identifying the causes of the trends observed in descriptive analysis. It looks for correlations and relationships.
- Examples: Analyzing why sales dropped in a specific region, examining the demographic factors behind a sudden increase in customer support tickets.
- Purpose: To understand the root causes of anomalies or performance shifts.
Type 3: Predictive Analysis (What is Likely to Happen?)
Moving beyond hindsight, predictive analysis uses historical data and statistical modeling to forecast future outcomes.
- Examples: Demand forecasting, sales pipeline prediction, churn prediction modeling, fraud detection.
- Purpose: To anticipate future trends and prepare proactively.
Type 4: Prescriptive Analysis (How Can We Make It Happen?)
The most sophisticated form of analysis, focusing on recommending specific actions to achieve a desired future outcome. It often uses optimization and simulation algorithms.
- Examples: Price optimization (suggesting the perfect price to maximize revenue), inventory optimization (suggesting optimal stock levels for every SKU).
- Purpose: To guide decision-makers directly toward the best course of action.
4. Key Tools of the Trade for Data Analysts
The tool you choose depends on the complexity of the data, the volume of information, and the required analytical sophistication.
Business Intelligence (BI) & Spreadsheet Software
- Examples: Microsoft Excel, Google Sheets, Microsoft Power BI, Tableau, Looker.
- Use Cases: For descriptive analysis, simple visualization, creating dashboards, and handling manageable datasets (up to a few million rows). These are often the entry point for most business users.
Programming Languages (Advanced Analytics)
- Examples: Python (with libraries like Pandas, NumPy, Scikit-Learn), R.
- Use Cases: For advanced statistical analysis, custom data cleaning, predictive modeling, machine learning, and automation. R is stronger in pure statistics, while Python is unparalleled for machine learning integration and general-purpose programming.
Databases & SQL
- Examples: SQL (Structured Query Language), PostgreSQL, MySQL, cloud warehouses (BigQuery, Snowflake).
- Use Cases: For querying, managing, and retrieving information from structured databases. Regardless of the analytical tool, a data analyst almost always needs SQL to access the data initially.
5. Turning Strategy into ROI: Business Application and Benefits
Data analysis is not merely a technical exercise; it is a catalyst for quantifiable business improvement.
Core Business Benefits of Data Analysis
- Data-Driven Decision Making: Eliminates guesswork and provides evidence-based certainty for strategic choices.
- Operational Efficiency: Diagnostic analysis can identify bottlenecks in production or supply chain workflows, suggesting optimization opportunities.
- Enhanced Customer Experience: Descriptive and diagnostic analysis help you understand your customer journey, allowing you to personalize offers, improve interfaces, and reduce friction.
- Competitive Advantage: Companies that actively use predictive and prescriptive analysis can anticipate market shifts and adjust strategies faster than competitors.
- Risk Mitigation: Predictive modeling is essential for fraud detection, credit risk assessment, and predicting equipment failure (preventive maintenance).
6. The Emerging Horizon: The Future of Data Analysis
The velocity and variety of data are increasing, and the analytical landscape is evolving in response.

Trend 1: AI and Machine Learning Integration
Artificial Intelligence (AI) is becoming embedded within analytical platforms. Machine learning is no longer just for specialized data scientists; BI tools are incorporating automated predictive forecasting, automated visualization creation from natural language prompts (“Copy-pilots” for data), and automated insight generation.
Trend 2: The Conversational Interface (Natural Language Processing)
The “language barrier” between business users and data is dissolving. Future analytics interfaces will allow leaders to ask questions in plain English (“What were our highest margin products last quarter?”) and receive automated visualizations and textual summaries in response.
Trend 3: Augmented Analytics
Augmented analytics uses machine learning to enhance the entire data analysis process, specifically Step 3 (cleaning), Step 4 (exploration), and Step 6 (sharing insights). Algorithms can automatically flag outliers during cleaning or suggest the best visualization type for the selected data.
Trend 4: Edge Analytics
As the Internet of Things (IoT) grows, data is being analyzed at the source (the “edge” of the network)—such as inside a manufacturing machine or a smart sensor—rather than being sent to a central warehouse first. This enables real-time responsiveness.
Conclusion: Data Analysis as a Continuous Journey
Data analysis is not a destination or a one-time report; it is a fundamental, ongoing business process. It is the practice of continuous learning from your organization’s own experience.
Organizations that succeed do not view data analysis as a technical hurdle but as a fundamental competency that empowers every department, from marketing and finance to logistics and human resources. By adopting a structured workflow—moving from defined questions to clean data, rigorous analysis, and clear communication—you can convert your organization’s overwhelming noise into the strategic signal that drives sustainable growth. The journey from information to insight is the most valuable road a modern organization can travel.